- YX Insights
- Posts
- June Nonfarm Payrolls: An Early Sign of Recession?
June Nonfarm Payrolls: An Early Sign of Recession?
Unemployment Rate on the Edge of a Trusted Recession Signal
Hi friends,
June Nonfarm Payrolls beat expectations again, adding 206k net new jobs versus a consensus of 191k.
Under the hood, however, the data are not as strong as their first seem.

Let’s dive into the details below 👇
DISCLAIMER: None of this is financial advice. This newsletter is strictly educational and is not investment advice or a solicitation to buy or sell any assets or to make any financial decisions. Please be careful and do your own research.
1. A narrow beat got dampened by big revisions

While June added 206k jobs, the blockbuster May data was revised down alongside April.
In total, April and May NPFs were reduced by a whooping 111k. The original releases represented an overestimate of over one third of the revised data.
Some of these errors are contributed by the fact that a lot of businesses do not respond to the surveys in time. The smaller the sample, the higher the margin for error. In statistical terms, BLS estimates the 90% confidence interval to be ± 130k jobs!

Source: Atlanta Fed
Looking at the sector breakdown, the biggest hirers came from Health care and Government. Apparently, the US Government is on a hiring spree. In an election year. Interesting.
2. Unemployment rate ticked up again
Household data show an increase of 116k in employment. Because participation rate went up a tick from 62.5% to 62.6%, unemployment rate is also up from 4.0% to 4.1%.
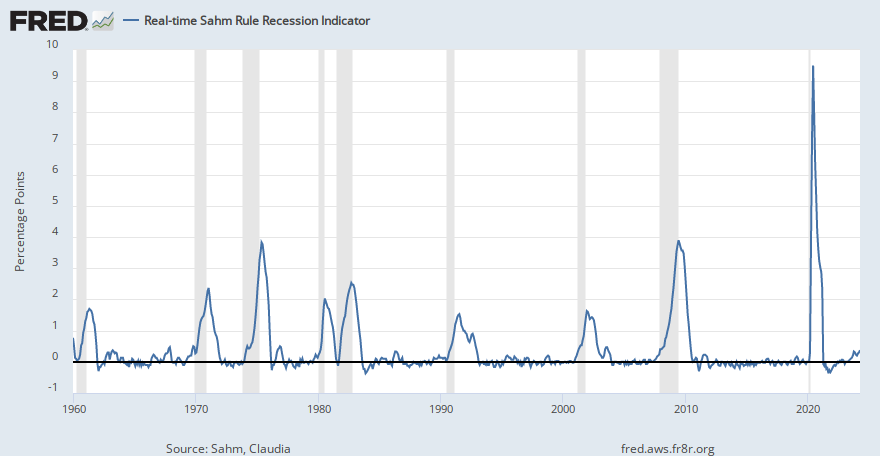
This is already slightly above the Fed’s year-end projection. The 3-month unemployment average is on the brink of triggering the ominous Sahm Rule.
Sahm Rule predicts recessions
Sahm rule states that a recession is underway if the 3-month average unemployment rate is 0.5% higher than the lowest point in the past 12 months.
The 3-month average unemployment rate in the US is now 0.43% higher than the 3.5% unemployment rate back in July 2023.
Why not already 0.5%? It is because the latest unemployment rate was actually 4.054% to be precise, so it pulled the 3-month average just below 4.0.

Source: FRED
If you look at the Sahm Rule chart above, it’s a pretty accurate indicator for nearly all of the past recessions.

Gif by news on Giphy
3. Wage increases slowed

Wages rose by 3.9% YoY (0.3% MoM) in June, which was a deceleration from April’s 4.1% YoY (0.4% MoM).
On a 3-month annualised basis, wage increase decelerated to 3.6% YoY. This is positive news because increases in earnings are directly associated with services inflation. Not all wage increases are productivity gains and businesses try to pass on the rising input cost into their pricing as much as they can.

4. Fed is likely comfortable
In Tuesday’s speech, Powell said the labour market is “cooling appropriately”.
The Fed is trying to convey that unless they see some bizarre spike in unemployment rate, they really do not mind labour market loosen a bit further.
4% or 4.1% unemployment is still historically low. Comparing it against an extremely tight 3.4-3.6% unemployment rate from a year ago does not really sense for monetary loosening.
If anything, the Fed wants to seen further weakening in the labour market and slower wage increases to reduce services inflation.
5. Rates rallied (yields lower) across the curve

Short-term interest rates (sub 2-year) bull-flattened today. Fed Funds yields fell 10-12bp amongst the 12-24 months Fed Funds futures.

The futures market was a bit messy today in terms of the FOMC steps, but the market is sticking with its Sep/ Dec cuts expectation for this year, and possibly consecutive cuts at the beginning of 2025.
Did you find this article useful?I really appreciate your feedback! |
Tools I find useful:
Seeking Alpha: I am the dedicated FOMC Commentator on Seeking Alpha News. Seeking Alpha provides in-depth investment news, research, and analysis to 250k+ members. Sign up here to get 20% on the Premium Membership (7-day Free Trial).
TradingView: I use TradingView for all my chart analysis. It is very fast and simple to play with, including the mobile and desktop apps. Sign up here to get $15 off your new TradingView plan.
Koyfin: I use Koyfin for stock screening, comparative analysis, and fundamental analysis. It provides very comprehensive data and features at a reasonable price. Sign up here to get 15% discount off all Koyfin plans.
Fastgraphs: I find Fastgraphs very useful in gauging whether a stock is underpriced or overpriced versus the fundamentals. Sign up here to get 25% off using the coupon “AFFILIATE25” at the check out.
A quick “Thank You”
I really appreciate your support for this newsletter.
Please feel free to share any suggestions or comments, either directly through email or DM me on X
— Yimin
Follow me on X
I'm on X to share:
1) US macro, yields, and liquidity analysis
2) US stock analysis - technical, fundamental, and valuation comparisons
3) $SPY, $QQQ, $IWM seasonality trends
4) Futures updates for Fed Funds, SOFR, $BTC, $ETH, $ES, $NQ, WTI , Gold
— Yimin Xu (@yxinsights)
11:50 AM • Jun 28, 2024


Reply